
Creative Infographic Design That Turns Data into Visually Appealing Impact
Transform your Complex Data into Striking Infographics Design — Partner with Patna’s Leading Creative Agency Today!
- Simplifies complex ideas with eye-catching visual storytelling.
- Boosts engagement across digital, product, and social platforms.
- Drives better retention with data made easy to grasp.
- Custom-crafted by Prachar Buzz’s creative design experts.
- Patna agency delivering global-quality infographic designs.
Infographic Design That Speaks Louder Than Words
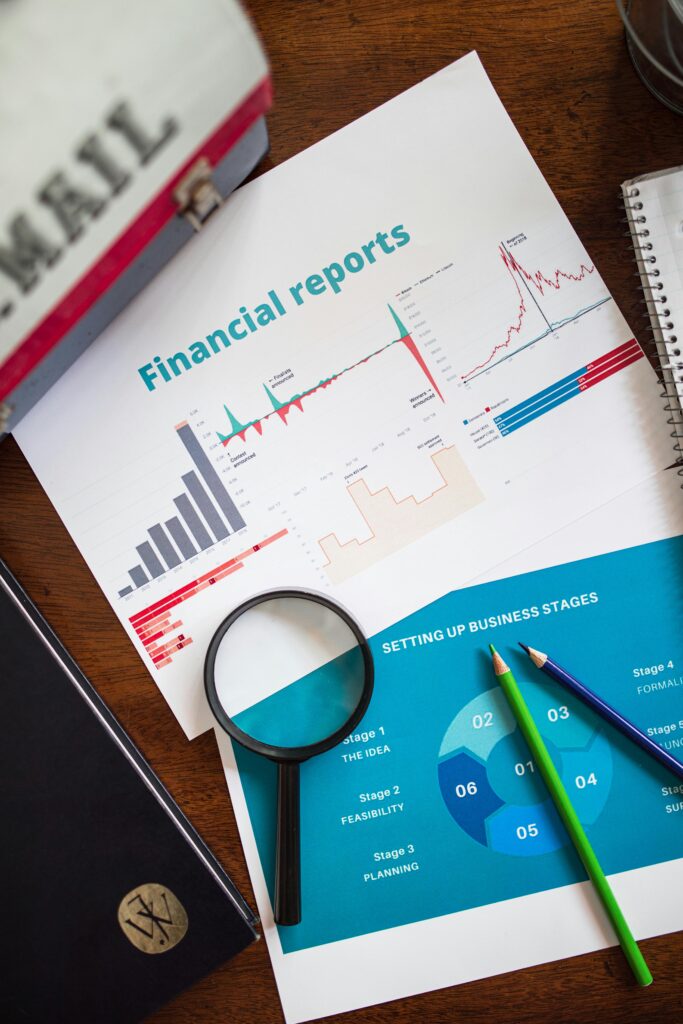
Information overload is real. That’s why smart brands use visuals to cut through the noise — and that’s exactly what our infographic design agency in Patna does.
We are a leading infographic design company in Patna, known for designs that not only look good but work hard. Every graphic is backed by strategy, tailored to your message, and created to boost engagement across digital platforms.
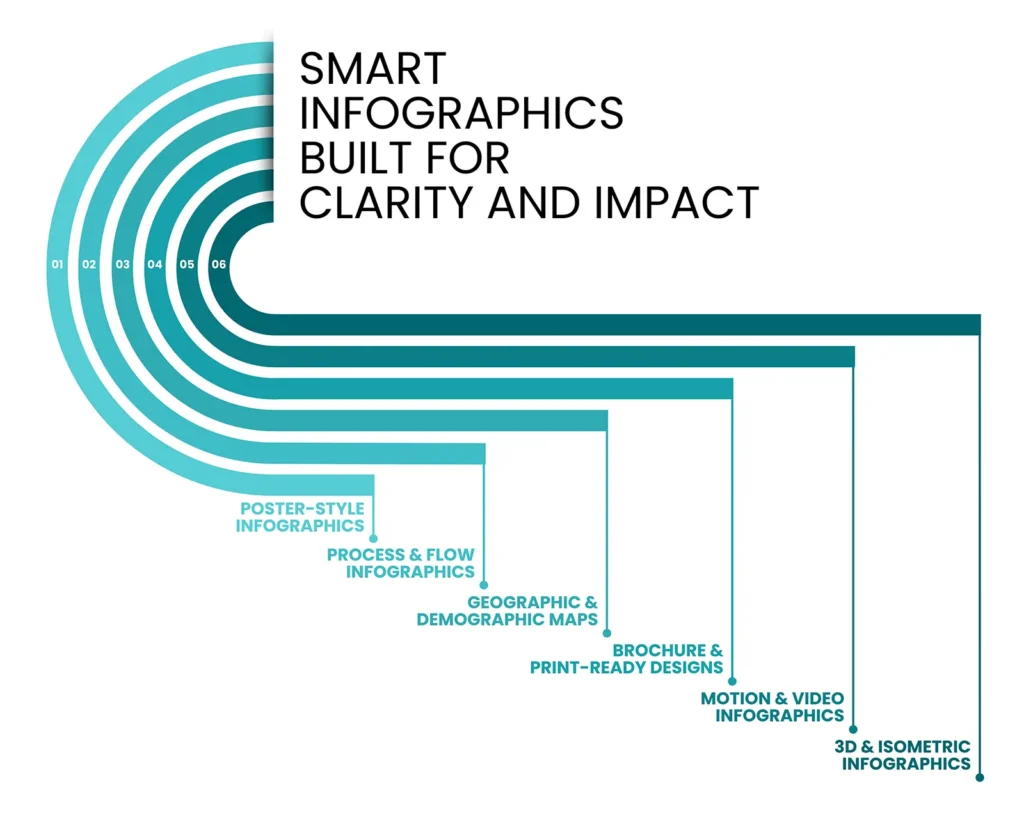
Our infographic designing services cover everything from clean charts to storytelling visuals:
- Infographic poster design
- Process and flowchart infographics
- Geographic infographics
- Brochure and print-ready infographics
- Interactive and video infographics
- 3D infographics
We don’t do one-size-fits-all. Every project is customized to fit your brand and audience. Whether you’re a startup, educational platform, healthcare brand, or corporate giant – we have got a design style that fits.
At Prachar Buzz, we help businesses turn boring data into bold, scroll-stopping visuals. Whether you need to simplify a process, show off key stats, or break down complex info, our infographics turn content into conversation.
Infographic Design 101: How It Boosts Your Brand
From what infographic design really means to how it helps your brand – here’s a quick guide that answers all your key questions. Whether you are curious about types, usage, or why your business should invest in it, this breakdown covers it all in simple terms.
Infographic design turns complex data into clear, engaging visuals using charts, icons, and illustrations. It helps people understand information faster and remember it longer. At Prachar Buzz, our infographic designing services simplify your message and make it stand out — whether it's for websites, reports, or social media.
An infographic poster combines text and visuals to explain a topic at a glance. It’s bold, simple, and perfect for offline use like classrooms, shops, or events. Our infographic poster designs are made to inform and impress.
A graphic focuses more on visual appeal, often without much text. An infographic includes text and visuals to explain or inform. At Prachar Buzz, we build both but for clarity and impact, infographics win.
Absolutely. Good infographics often rely on strong visuals to support the message. Images help grab attention and make information easier to remember. Our infographic design agency in Patna builds every visual with purpose.
Different types include process charts, timeline visuals, data infographics, and infographic posters. Each style suits a different purpose—education, marketing, or reporting. Prachar Buzz tailors every infographic design to your exact need.
A professional agency turns dry facts into visuals your audience wants to see. We make your brand look smarter, clearer, and more trustworthy. Prachar Buzz is the infographic design company in Patna that does exactly that.
The goal of infographic design is to simplify complex info through clear visuals. It helps people learn faster and retain more. With our infographic designing services, your content becomes easy to understand and remember.
They are fun, effective, and perfect for getting your message across quickly. Infographics boost engagement, explain tough topics, and are shareable on every platform. Whether you're a brand or educator — they're a powerful tool.
Turn Information Into Impact with Smart Infographic Design Agency in Patna
Visual content that informs, impresses, and converts.
At Prachar Buzz, we offer infographic design services that help brands communicate smarter. Whether you’re pitching to investors, educating customers, or simplifying complex data—our visuals do the talking. As a leading infographic design agency in Patna, we create custom designs that boost engagement, drive clarity, and leave a lasting impression.
From business reports to social media content, our infographics are made to match your goals and audience. Here’s what we offer:
Business Infographic Design
We turn complex business data into clear, easy-to-understand visuals. These infographics help your audience grasp key insights faster perfect for reports, presentations, and internal communications.
Company Infographic Design
Tell your brand’s story through strong visuals. Our infographic designers help you highlight company achievements, growth, processes, and values in a format that’s both engaging and professional.
Corporate Infographic Design
Corporate data doesn’t have to be boring. We design corporate infographics that simplify research, showcase industry insights, and present your data in a polished, strategic format.
Animated Infographic Design
Our animated infographic design use motion and storytelling to make even the most technical topics engaging. Ideal for digital campaigns, presentations, and product explainers.
Creative Infographic Design
When you need something bold, unique, and unforgettable our creative infographic design service blends data, design, and imagination to visually express ideas in ways text alone never could.
Infographic Table Design
We turn plain tables into visual assets. Our table infographics are designed to be simple, scannable, and structured—making data comparisons easy and attractive.
Timeline Infographic Design
Timeline infographics are perfect for showing progress, processes, or history. We design clean, chronological visuals that tell your story clearly—from brand journeys to project timelines.
Infographic Layout Design
Great content needs great structure. Our infographic layout design focuses on clarity, flow, and visual balance ensuring your message is easy to follow and leaves no room for confusion.
Static vs Interactive Infographics: What’s Right for You?
Aspect | Static Infographics | Interactive Infographics |
Format | Flat image (JPEG, PNG, or PDF) | Built with HTML, JavaScript, or design platforms with clickable/animated elements |
Engagement | Passive—view only | Active—users can click, hover, zoom, or scroll |
Distribution | Easy to share on social media, blogs, WhatsApp, and print | Best suited for websites, microsites, and presentations |
Loading Speed | Lightweight, fast loading | Heavier, may need optimization for web performance |
Ease of Creation | Quicker and more affordable | Time-intensive and may require a developer or animation support |
User Control | Designer controls the message flow | User controls what to explore or focus on |
SEO Value | Limited unless embedded with text | Higher SEO potential when properly coded into a webpage |
Use Cases | Infographic design for social media, WhatsApp marketing, printed reports | Infographic design for website, investor decks, product demos |
Visual Complexity | Best for straightforward data or storytelling | Great for layered data, interactive storytelling, or live dashboards |
Cost | Lower | Higher, based on features and complexity |
Types of Infographics We Design at Prachar Buzz
Different messages need different formats – and as one of the leading infographic design company in India we understand infographic design isn’t one-size-fits-all. Here are the most effective infographic types we offer at Prachar Buzz, tailored to match your content goals.
Supporting Subheading
Why it is important?
Where Infographics Design Work Best
Infographics are visual power tools they simplify data, capture attention, and get your point across fast. Here’s how you can use them across different platforms and goals:
Infographic Design for Websites
Add visual storytelling to your blogs, landing pages, or homepage. Infographics break down complex topics, improve readability, and help with SEO by increasing time-on-page and linkability.
Infographic Design for Social Media
On platforms like Instagram, LinkedIn, and Pinterest, scroll-stopping visuals win. Infographics make stats, comparisons, how-tos, and quotes instantly digestible perfect for engagement and shares.
Infographic Design for Digital Marketing
Whether it's emailers, Google Ads landing pages, or WhatsApp campaigns—infographics make your message clearer and more clickable. Great for boosting conversions without extra noise.
Infographic Design for Product Marketing
Explain features, benefits, or usage instructions visually. Product infographics are especially useful for launches, packaging, ecommerce pages, and customer onboarding.
Infographics for Pitches & Reports
Whether convincing investors or team updates, infographics turn complex data into clear, visual stories. They cut through clutter keeping both internal and external audiences engaged and aligned.
Infographics for Print Collateral
From brochures and catalogs to exhibition posters—infographics add structure and visual clarity, making your print designs both functional and appealing.
More Than Just Infographic Design
At Prachar Buzz, we offer a full range of graphic design and animation services to help you stand out. From scroll-stopping social content to brand-building visuals, we turn creative ideas into real business impact.
Infographic Design
We create static and interactive infographics that simplify information and engage your audience.
Presentations
Visually strong presentations that clearly communicate your brand, product, or message.
Social Media Graphics
Custom social designs that grab attention, build engagement, and boost your brand’s online presence.
Video Content
From explainer videos to animated stories, we help you connect with your audience through motion and meaning.
Brand Identity Design
Logos, color palettes, and visual systems, everything you need to build a strong, lasting brand.
Ebooks & Digital Guides
Inform, educate, and convert with visually engaging eBooks that showcase your expertise.
Microsite Design
Product-focused microsites that are fast, eye-catching, and designed to convert.
Website Design
Functional, modern websites that tell your story and turn visitors into customers.
Need custom infographic poster design?
Looking for an infographic design company in Patna that gets your brand?
Prachar Buzz has the skills, tools, and creativity to turn your ideas into high-impact visuals.
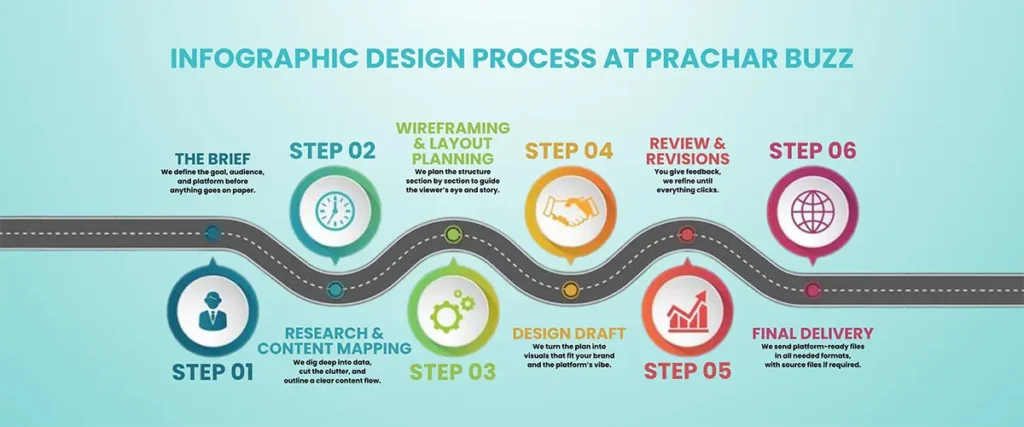
Infographic Design Process at Prachar Buzz
From brief to brilliant — here’s how we turn ideas into impactful visuals. Our process blends research, design thinking, and storytelling to create infographics that aren’t just pretty, but purposeful.
Why Choose Prachar Buzz for your Infographic Design needs?
We don’t just design, we think, research, and deliver visuals that work. Our infographic design agency in Patna is driven by clarity, creativity, and your goals. Here’s why businesses trust us:
Research-Led Designs
We start with research, not guesswork. Every infographic is built on solid insights to match your message and your audience.
Multiple Creative Options
You get more than one concept to choose from. We design, revise, and fine-tune until it fits your vision.
White Label Services
Working with international clients or agencies? We offer white-label infographic designing services that meet global standards and keep you in the spotlight.
Transparent & Competitive Pricing
No inflated quotes. No awkward negotiations. Just fair pricing for high-quality design work that speaks for itself.
Fast Turnaround Time
Need it soon? We deliver your first draft in 48–72 hours, so you are never left waiting.
Graphic Revisions That Match Your Vision
We offer multiple design changes to refine every creative until it aligns perfectly with your brand.
Brand-Focused Approach
We design with your brand in mind. Every infographic aligns with your visual identity and communication style to keep your message consistent.
Easy to Understand, Easy to Act On
Our visuals don’t confuse, they clarify. Whether it’s a complex report or a simple idea, we make it digestible and action-worthy.
User-First Mindset
Your goals come first. Our design process is built around what your audience needs to see, know, and feel.
End-to-End Support
From concept to final delivery, we handle it all. You set the goals, we turn them into impactful infographic design.
Grow With Us
Infographics Can Be Fun Too
Who says infographics have to be all charts and stats? At Prachar Buzz, we believe visuals can inform and entertain.
Pop Culture Breakdowns
From Bollywood drama to trending reels—explained visually, with just the right amount of sass.
Funny Timelines & Lists
Client feedback types, agency life decoded, or “Monday moods” charted out. You’ve seen it. You’ve lived it.
Festive & Seasonal Specials
Create light-hearted infographics around festivals, office jokes, or quirky observances memes, fun formats and brand-relevant.
Visual Quizzes, Polls & Games
Visual quizzes, polls, and games turn data into fun, clickable content your audience loves to engage with.
Meme-Style Infographic Formats
Meme-style infographics blend humor with insight—scroll-stopping content your audience actually wants to share.
What Is an Infographic and Why It Works for Business ?
An infographic is a smart mix of visuals and information. It takes data, processes, or concepts and turns them into clean, easy-to-understand graphics.
Now here’s why businesses love it:
People don’t remember long paragraphs. But give them one well-designed graphic? They will get the message in seconds and remember it for days.
- Want your data to connect, convert, and stand out? Prachar Buzz - the infographic design company in Patna that gets it right.


Infographic Designing Services that works
Why Infographics Work So Well for Business?
- Quick to Grasp: Our brains process visuals faster than text.
- Boost Engagement: People are more likely to share an infographic than a plain article.
- Better Communication: Simplifies complex topics like stats, timelines, and workflows.
- Professional Impression: Makes your brand look polished, thoughtful, and data-driven.
- SEO Value: Infographics can bring backlinks when shared, helping you rank better.
Our Exclusive Client's
Project Sites


Frequently Asked Questions
Lorem ipsum dolor sit amet, consectetur adipiscing elit, sed do eiusmod tempor incididunt ut labore et dolore magna aliqua. Ut enim ad minim veniam, quis nostrud exercitation.
Lorem ipsum dolor sit amet, consectetur adipiscing elit, sed do eiusmod tempor incididunt ut labore et dolore magna aliqua. Ut enim ad minim veniam, quis nostrud exercitation.
Lorem ipsum dolor sit amet, consectetur adipiscing elit, sed do eiusmod tempor incididunt ut labore et dolore magna aliqua. Ut enim ad minim veniam, quis nostrud exercitation.
Our Happy Clients!